Effective data storytelling

Recent Blog Posts

  • Why The Pyramid Principle Is Not A Data Storytelling Framework

    Over the last 50 years, Barbara Minto's Pyramid Principle has transformed business communication with its top-down approach. Many practitioners don't realize Minto highlighted two situations where it isn't suitable. Surprise, surprise. Data stories fill the gaps where the Pyramid Principle leaves insights implied and unexplained.

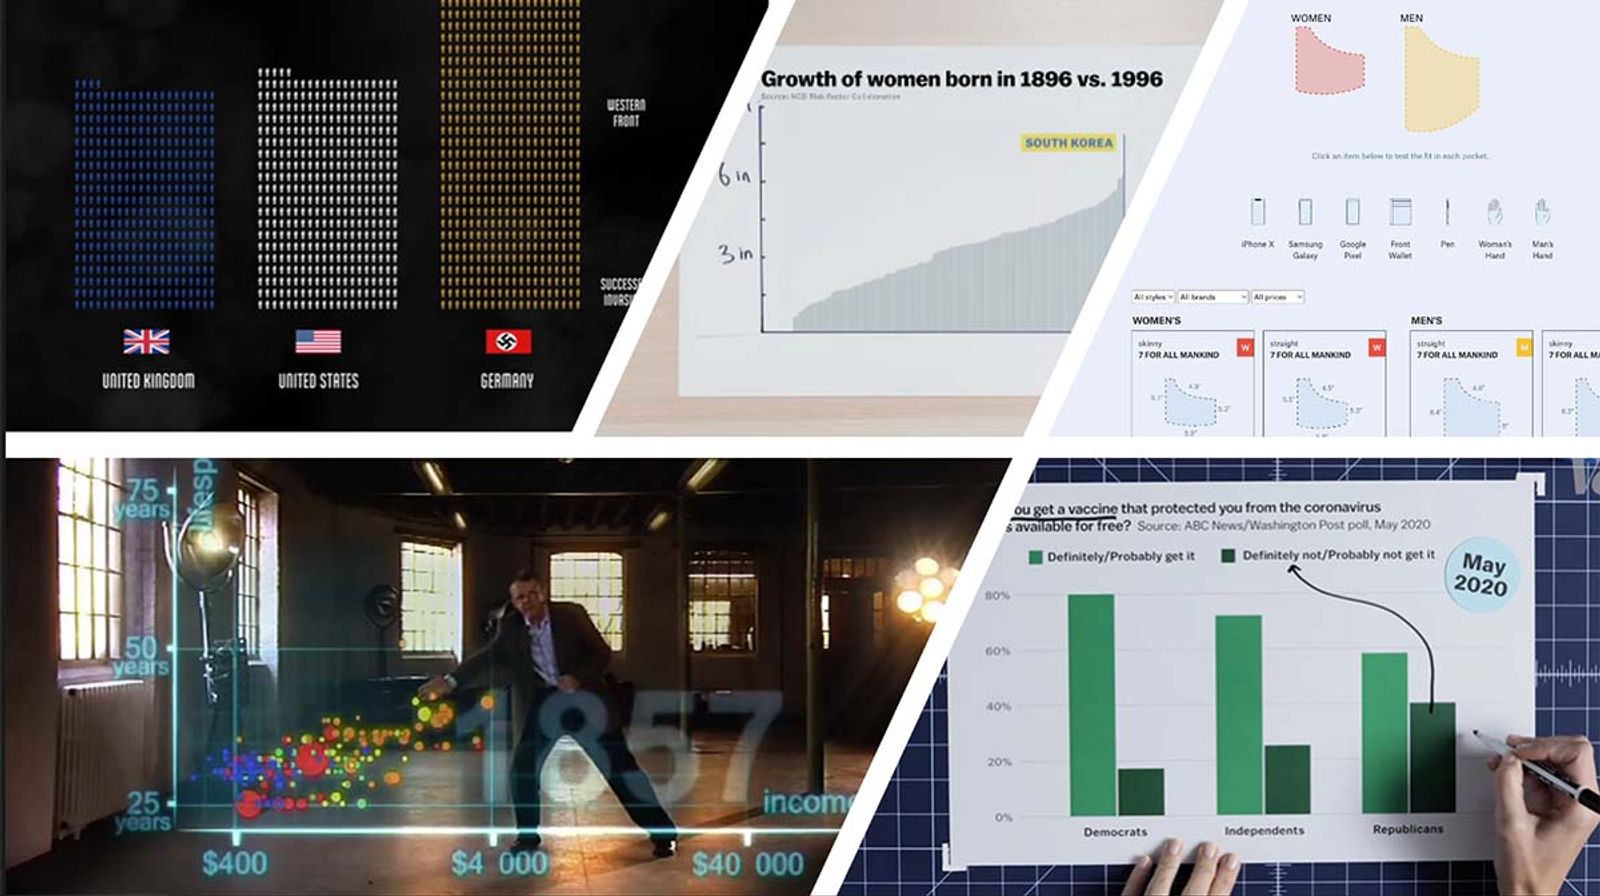
  • Five Excellent Data Storytelling Examples (And What Makes Them Work)

    If you want to improve your data storytelling craft, you've probably looked for solid examples and come up empty-handed. Here, I break down five of the best freely accessible data stories I found, looking at why they work, what makes them stand out, and even where they could be stronger.

  • Why Charts Designed For Dashboards Fail In Data Stories

    Why do clear, well-designed dashboard charts lose impact in presentations? Because dashboards and data stories optimize for different goals. This post introduces four design lenses that explain the tradeoffs and why repurposing charts without rethinking design often falls short.

  • Measurement Over Metaphor: Rethinking The Conversion Funnel

    Traditional funnel charts look intuitive but distort reality—hiding drop-offs, misaligning comparisons, and emphasizing what remains over what’s lost. This post examines five challenges in visualizing funnels and introduces the Framed Funnel Chart—a bar-inspired redesign that preserves flow while enhancing accuracy, readability, and comparability.

  • Data Storytelling 101: A Beginner's Guide To Turning Insights Into Action

    Think your numbers speak for themselves? Think again. Even the most powerful insights fall flat without the right storytelling approach. This comprehensive guide walks you through the five foundational elements of data storytelling—from understanding your audience to crafting compelling narratives. Whether you're new to data communication or looking to sharpen your skills, you'll learn practical techniques to turn insights into action.

  • May The Data Be With You: 10 Analytics Lessons From The Empire Strikes Back

    The Empire Strikes Back offers surprising lessons in analytics—from psychological safety and confirmation bias to the importance of experimentation and action. Using iconic scenes, the article connects Star Wars moments to real-world data challenges, showing how technology, empathy, and human judgment play key roles in effective decision-making. Insight alone isn’t enough—execution, communication, and context are essential.

  • Five Reasons Executives Hate Business Reports—and How SPARK Fixes Them

    Struggling to make your business reports resonate with executives? Discover the five common frustrations leaders face—and how the SPARK Reporting Framework can fix them. Learn how to create reports that are stakeholder-focused, purpose-driven, accurate, readable, and action-oriented to drive better decisions and real business impact.

  • Does Your Organization Have A Balanced Data Diet?

    The MyDataPlate framework proposes a balanced approach to data communication across four essential categories: Monitor (tracking anomalies in real-time), Report (providing periodic performance summaries), Explore (investigating patterns and causes), and Explain (translating findings into actionable recommendations). Many organizations over-invest in monitoring and reporting while neglecting exploration and explanation, resulting in data-rich but insight-poor environments that fail to drive meaningful business outcomes.

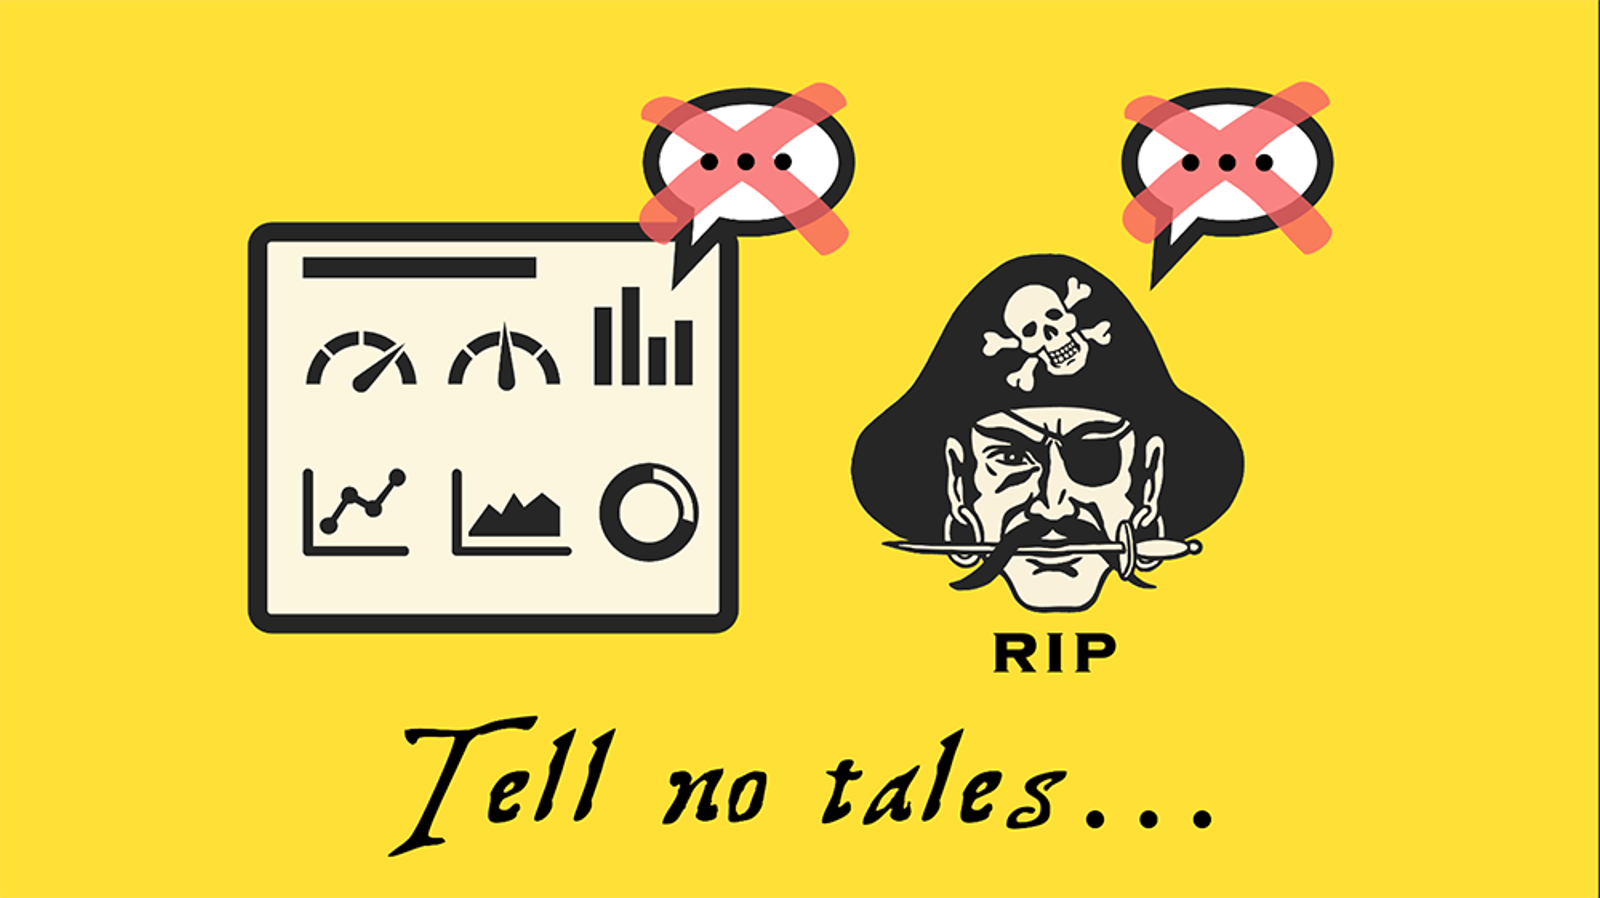
  • Why Dashboards (and Dead Men) Tell No Tales

    Can dashboards really tell stories? Just as dead men tell no tales, dashboards remain silent without a storyteller to bring their data to life. While business intelligence vendors tout automated storytelling capabilities, dashboards serve a different purpose--'storyframing.' Learn why dashboards fall short as storytelling tools and discover the four essential human elements required for impactful data stories. Rather than chasing automated solutions, organizations need to empower their analysts to craft meaningful narratives that drive action.

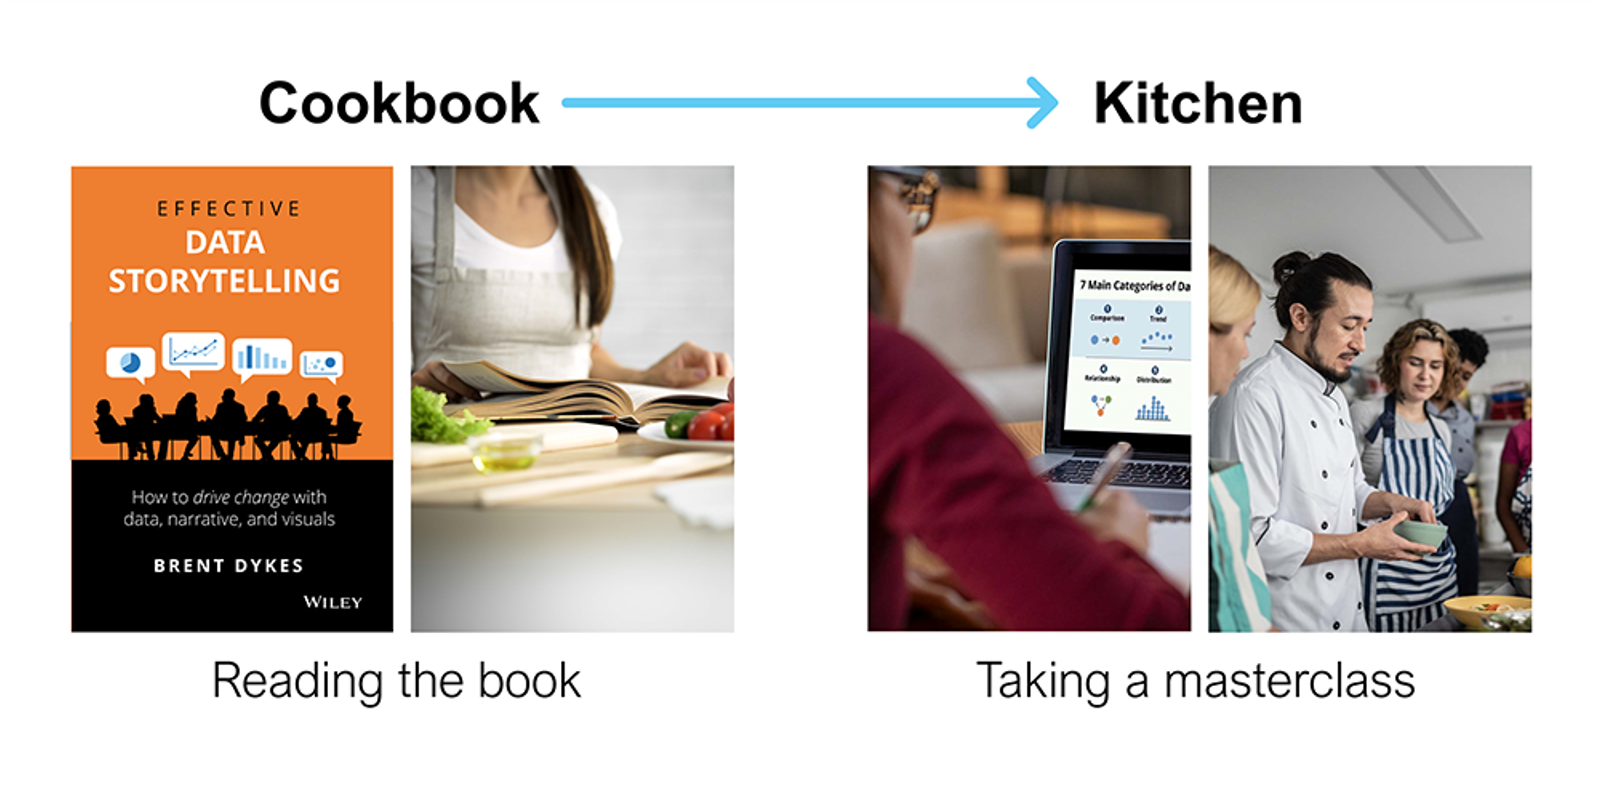
  • From Cookbook To Kitchen: Six Ways My Data Storytelling Masterclass Elevates Your Skills

    A cookbook can teach you recipes, but a master chef can transform your cooking. In this post, I reveal how my data storytelling masterclass goes beyond my book's foundations to elevate your skills through hands-on practice, updated frameworks, and expert guidance. Discover six key benefits that help you craft more compelling, actionable data stories that drive decisions.

  • Data Stories vs. Stories With Data: What's The Difference?

    Some use the terms 'data stories' and 'stories with data' interchangeably. Even though they can both leverage data, narrative, and visuals, they serve different purposes and use distinct approaches. To master the art of data storytelling, you must know the important differences between these two common forms of data-related stories.

  • Drawing Insights: What Data Storytelling Can Learn From Comic Books

    When you compare data storytelling to any other communication medium, you'll discover an interesting parallel between comic books and data stories. Both of these storytelling formats must balance visuals and words to tell their stories. In this article, I explore five key lessons data storytellers can learn from the world of comic books.

  • Narrative Reporting vs. Data Storytelling: Complementary But Not The Same

    Increasingly, more context and interpretation are being added to standard reports. While narrative reporting employs similar tactics and is complementary to data storytelling, it fundamentally differs in its emphasis and structure. In this article, I will explore how narrative reporting is unique from data storytelling and how they can work together in the analytics process.

  • Data Storytelling Arc: Demystifying Narrative Structure In Data Stories

    One of the most challenging aspects of data storytelling isn't visualization but instead narrative. For many people, it can be somewhat of an enigma. One of the most crucial contributions that narrative makes to data stories is structure. This article reviews different narrative models and then introduces a powerful four-step narrative model for data storytelling.

  • A Data Storyteller’s Guide To Avoiding Clutter

    In data storytelling, you want your signal (insight) to be understood and acted on by your audience. Frequently, noise in the data or design can interfere with your message. In this article, I review five categories of potential clutter and provide recommendations on how to avoid clutter in the data scenes of your data stories.

  • Two Important Perspectives On Why Data Storytelling Matters

    When people are asked why data storytelling matters, most of the focus is on the benefits that can be derived by the individuals communicating the insights. However, there are two key perspectives to consider when contemplating why it matters--that of the sender and that of the receiver. While individuals will gain much from developing data storytelling skills, it's ultimately the audiences who will be the greater beneficiaries. This article explores how each side benefits from data storytelling and how data stories can collectively enhance your organization's overall success.

  • Storyframing And Storyforming: Two Essential Steps That Precede Data Storytelling

    Most of the focus on data storytelling is centered on the crafting and telling of data stories. However, to become a better data storyteller, it's important to recognize and understand the two essential steps that precede the telling of a data story--storyframing and storyforming. This article explores the roles that these two exploratory steps can play in identifying meaningful insights before they are crafted and shared as data stories.

  • Elephant In The Room: Data Storytelling Is More Than Just Data Visualization

    For many people, data storytelling is just an extension of data visualization. Most of the focus is spent on the explanatory data visualization techniques that are employed in data stories. By focusing primarily on the visuals, the two other key elements of data stories--data and narrative--are often misunderstood and overlooked. It's time for organizations to embrace a more balanced approach to data storytelling that is centered around the effective communication of insights, not just the data visualization aspects.

  • Contextualized Insights: Six Ways To Put Your Numbers In Context

    When you share insights with audiences, they must be put in context so they can be fully understood and appreciated. While almost everyone would agree on the importance and value of context, there is little-to-no guidance on how to contextualize numbers. In this post, I share six ways in which you can add valuable background information to your key insights so they can resonate more deeply with audiences.

  • Data Storytelling: What It Is And Is Not

    As data storytelling has grown in popularity over the years, there's still some confusion about what it really is--and is not. This article explores what data storytelling is, why it's important, and what shouldn't be considered data storytelling.

  • 4 Keys To Better Data Interpretation Skills For Any Manager

    Many managers are uncomfortable with interpreting the numbers in their reports and dashboards. If this common data literacy problem isn't addressed across management levels, companies will continue to struggle in their efforts to develop data-driven cultures. In this article, I cover four key areas of data interpretation that are essential for all managers who are striving to make data-informed decisions.

  • 100 Essential Data Storytelling Quotes

    As I was writing my book, I gathered 100 quotes related to data storytelling. They are all featured in my book and span 10 different categories from action to visualization. I hope you find them as inspiring as they were to me.

  • Data Literacy And Data Storytelling: How Do They Fit Together?

    Data literacy is a key focus of many organizations as they seek to help their employees take full advantage of their data. While data storytelling is often included in data literacy training, the question is whether it is a required skill to be data literate. In this article, I explore the minimum viable skills someone needs to qualify as being data literate. I then share where data storytelling fits in the data literacy landscape.

  • Every Good Data Story Has An Insight At Its Core

    Today, more and more people realize there is more to data storytelling than just data visualization. If you were to evaluate what makes a data story "good," you'd discover one crucial ingredient that's necessary--a meaningful insight. In this article, I review what insights are and the critical role they play in data stories. I also share thoughts from a recent journal article by Sorin Adam Matei and Lucas Hunter on the importance of insights to data storytelling in science communication and data journalism.

  • Data Storytelling: Is It Art or Science?

    Data storytelling is one of the few data skills that combines both disciplines of art and science. In this article, I look at the different elements under each discipline and explain how they contribute to crafting and telling data stories effectively.

  • Why Data Storytelling Requires a Mindset Shift

    To become an effective data storyteller, you must shift your mindset from being reporting centered to embracing a different storytelling approach. In this article, I introduce the Insight Funnel and how reports/dashboards complement data stories. Then I explore the six key approach differences between reports/dashboards and data stories.

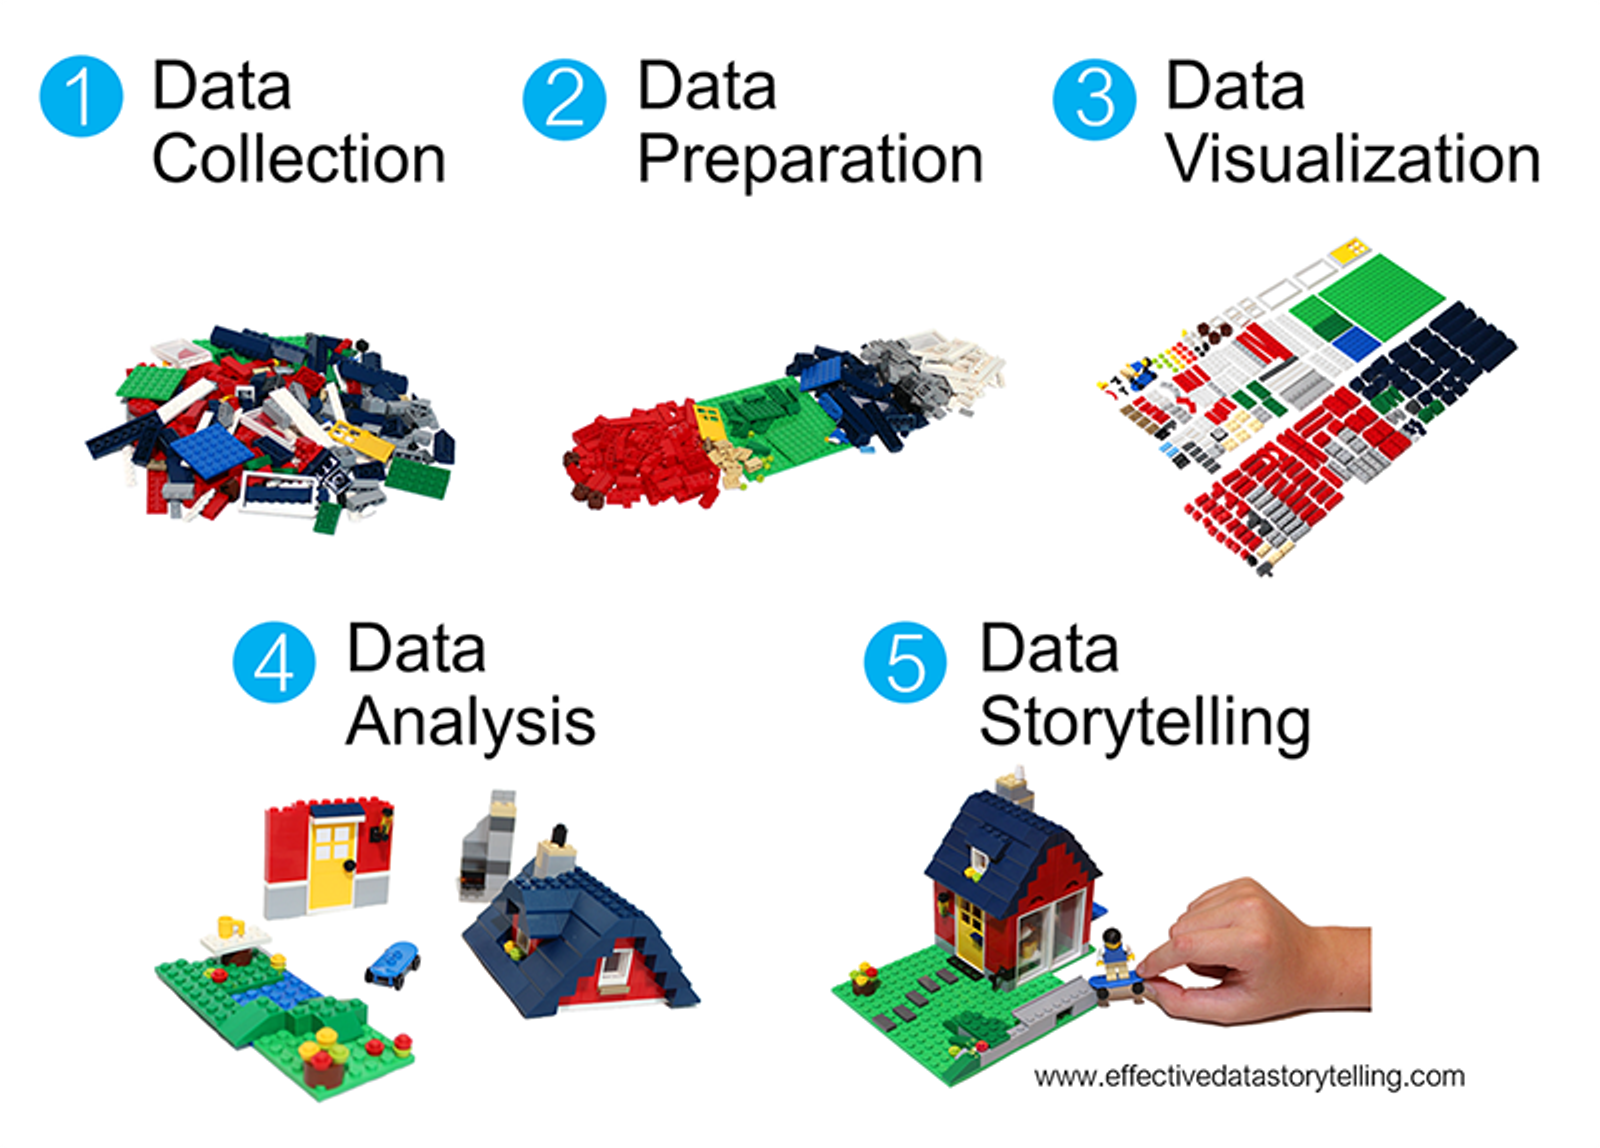
  • A Deeper Dive into LEGO Bricks and Data Stories

    Recently, an image that associated LEGO bricks with data storytelling went viral on LinkedIn. As a LEGO fan and data storyteller, I decided to take a closer look at the five-step process from raw data to a data story. I developed my own version that I feel corrects some of the flaws in the original image. I believe this analogy can be useful in explaining the process of how a data story comes together.

  • Six Visual Myths That Won’t Go Away—But Should

    As a data storyteller, you believe in the persuasive power of visual information. However, many of the popular statistics related to visual communication and perception cannot be trusted due to suspect citations and sources. We need to stop relying on these dubious statistics to preserve the integrity of our visual craft.

Get the Book

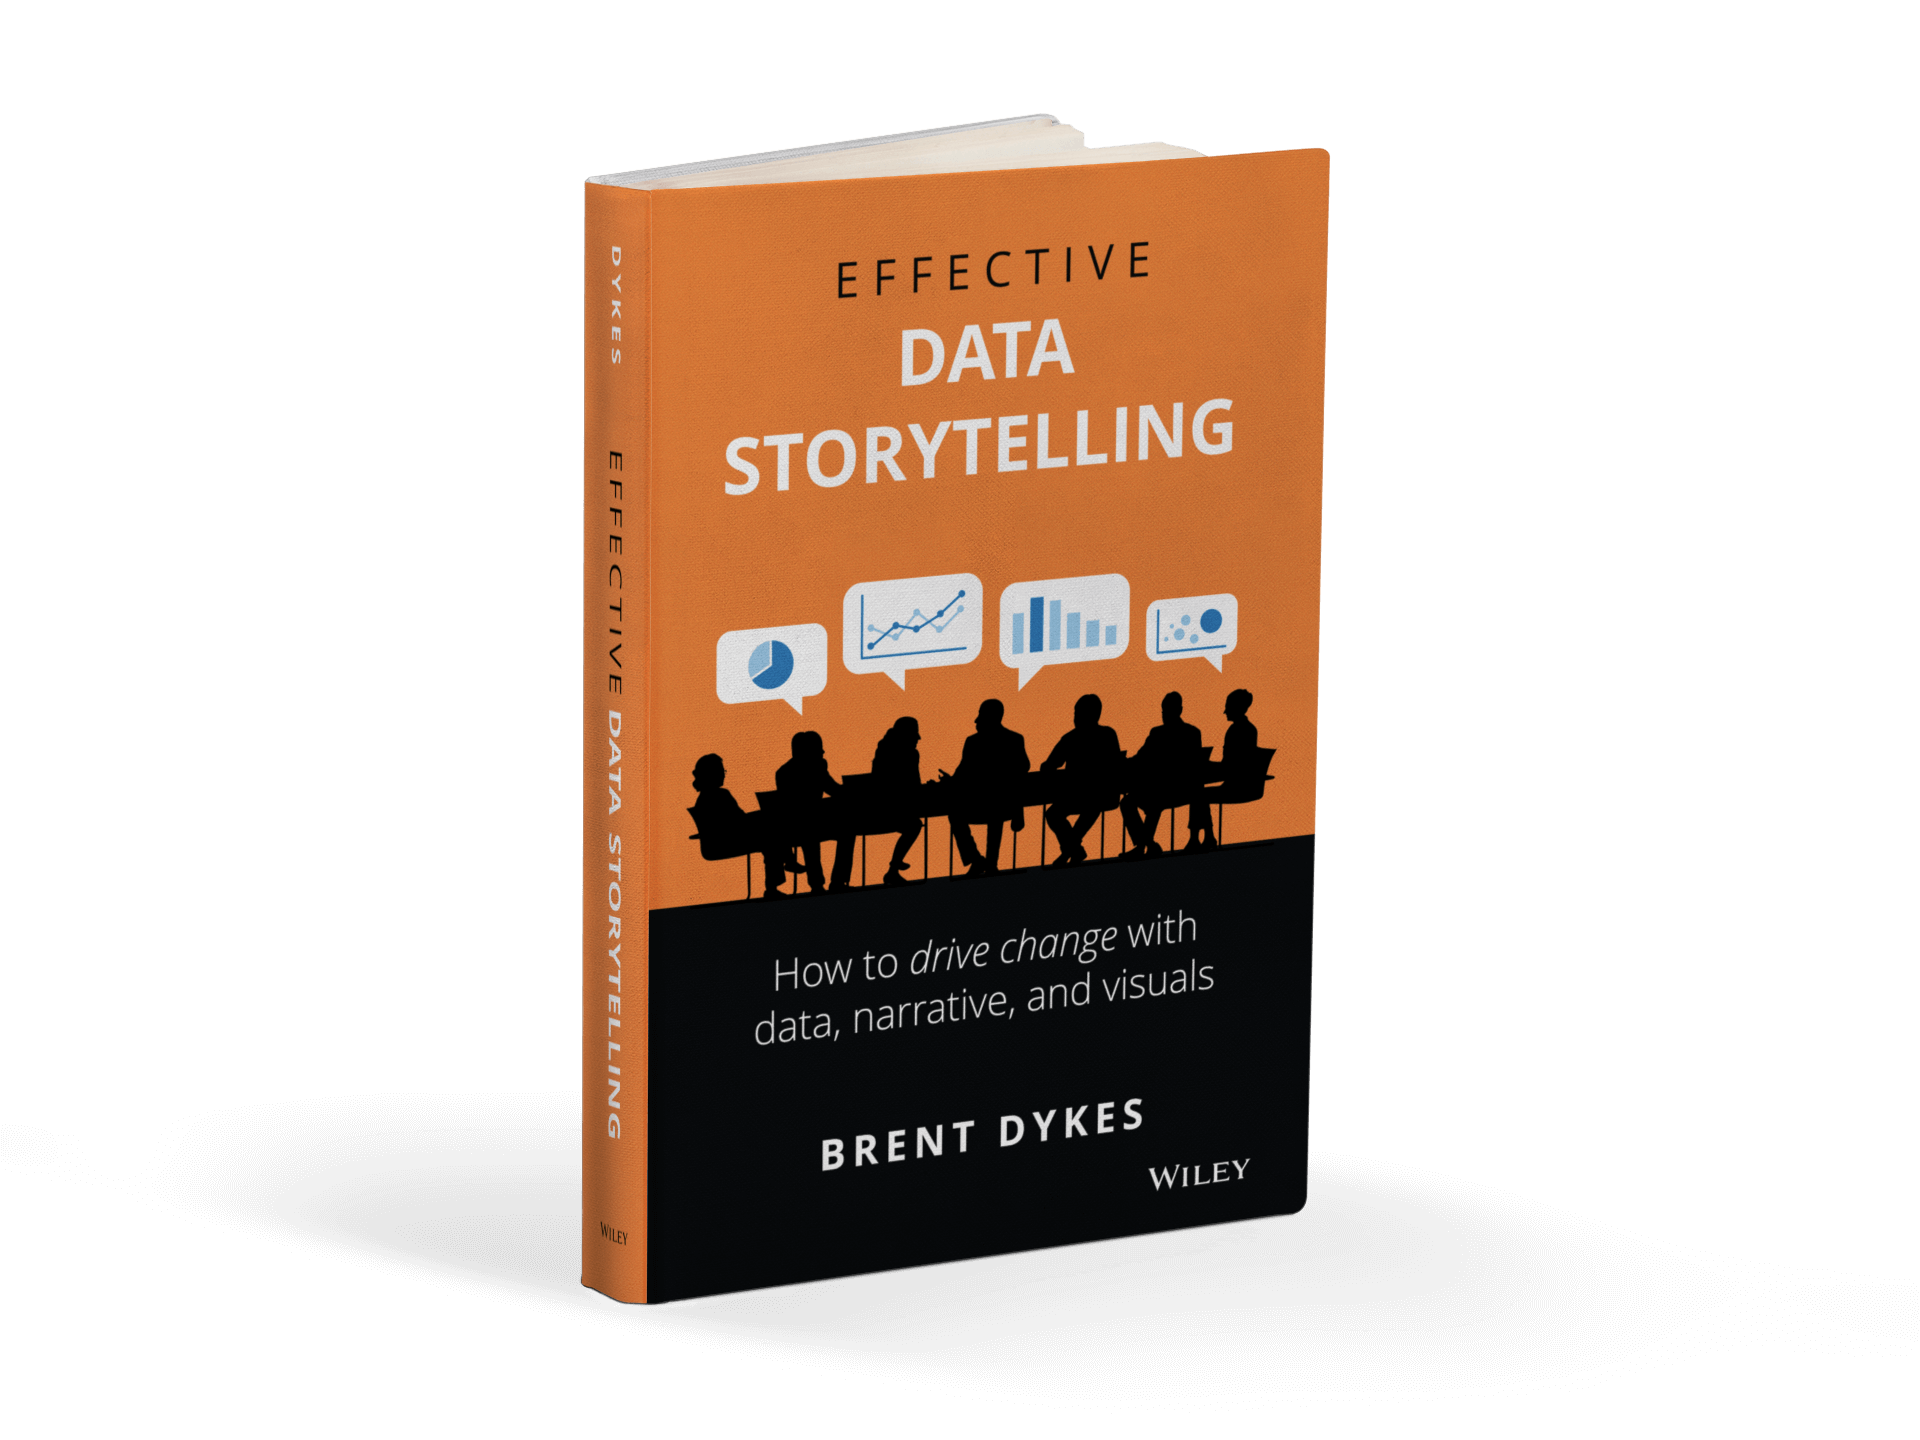
Effective Data Storytelling

Master the art and science of data storytelling—with frameworks and techniques to help you craft compelling stories with data.

Effectively communicating with data is a necessity in organizations of all types and sizes. It’s often the crucial last mile in the analysis process that determines whether an insight will inspire action. Transforming data into visual communication is only one part of the picture—it’s just as important to engage your audience with a memorable and persuasive story. Narratives are more powerful than raw statistics, more enduring then pretty charts. Effective Data Storytelling teaches you how to communicate insights that influence decisions, inspire action, and drive change.

  • Amazon Store Logo
  • Bam! Books-a-million store logo
  • Barnes & Noble Booksellers